
MARKET UPDATE
Last week’s cash fed cattle trade brought about an unexpected uptick in prices as Nebraska and Cornbelt feedlots captured values $2 to $4/cwt. higher, averaging $180 to $184/cwt. The wide price spread remains, contrasting the northern to southern regions with Texas and Kansas live cash trade occurring at $170 to $171/cwt. That represents roughly a $1/cwt. Weekly advance.
Carcass weights continue their seasonal decline toward the spring lows but latest weight data shows a trend shift. Starting at the first of the year, weights had trended primarily in a range of 15 to 20 lb. lighter than a year ago due to extreme weather conditions and a current fed cattle supply. Yet carcass weights declined more rapidly in the second quarter of 2022 in contrast to this year’s more marked decline in the first quarter, which has given way to smaller downward moves in the second quarter.

Average steer weights actually moved up four pounds in the first week of May before dropping four pounds in the subsequent week. The slowing trend suggests a potential earlier realization of the year’s lightest carcass weights versus the mid-June timeframe marked in the past two years. Industry average carcass marbling achievement will be assisted in the upfront weeks if this shift occurs.
On the product side of the business boxed beef values were mixed in last week’s report with weekly average cutout values varying slightly depending on grade. The CAB cutout was up just $0.34/cwt. while commodity Choice was lower by $0.24/cwt. Select gained on Choice a bit with a $1.21/cwt. cutout increase. This presented a softer Choice/Select price spread in line with that of a year ago. The CAB premium to Choice firmed up fractionally to average $12.66/cwt., placing it almost $2/cwt. lower than a year ago.
A relatively strong quality grade mix, considering the time of year, plus recent upticks in weekly fed cattle slaughter is underpinning production volume in the commodity Choice and Premium Choice brands certified into branded programs. This has CAB traditional carcass counts in the 121,000 per week average for the past four weeks versus 119,000 for that period a year ago. Lighter cut weights for the period compressed pounds per head but as indicated above, weights are now par to a year ago.
Prime Carcass Tonnage Set to Decline
Most recent USDA quality grade data updates carcass grading trends through May 19th. This is precisely the week on the calendar at which the percentage of carcasses meeting USDA Prime marbling levels have sharply decreased in each of the past three years.
Throughout the supply chain many stakeholders are familiar with the annual spring phenomenon when U.S. average quality grades typically decline from winter highs toward spring lows. Many of us may think of the grade decline following a trend line generally paralleling that of the annual, similarly predictable, carcass weight lows around this time of year. While lighter average carcass weights are correlated with lower marbling scores, the annual realization of the lowest measurements for each of these traits is far from perfectly aligned.
Assessing any annual carcass weight pattern in recent history results in the same line graph shape each year. The variation is found in the details as it relates to the exact date that the annual high and low weight weeks are realized. Except for the COVID irregularities of 2020, the annual low has been reached from May 1 through early June in the past 10 years.
It is much more difficult to predict the week when the annual low in the combined percent Choice and Prime quality grades is realized. In the past 10 years the “low grade” week occurred as early as mid-April and as late as the end of October. In the most recent 4 years the lows were placed in September or October. From 2014 to 2018 the lows came in April and May.
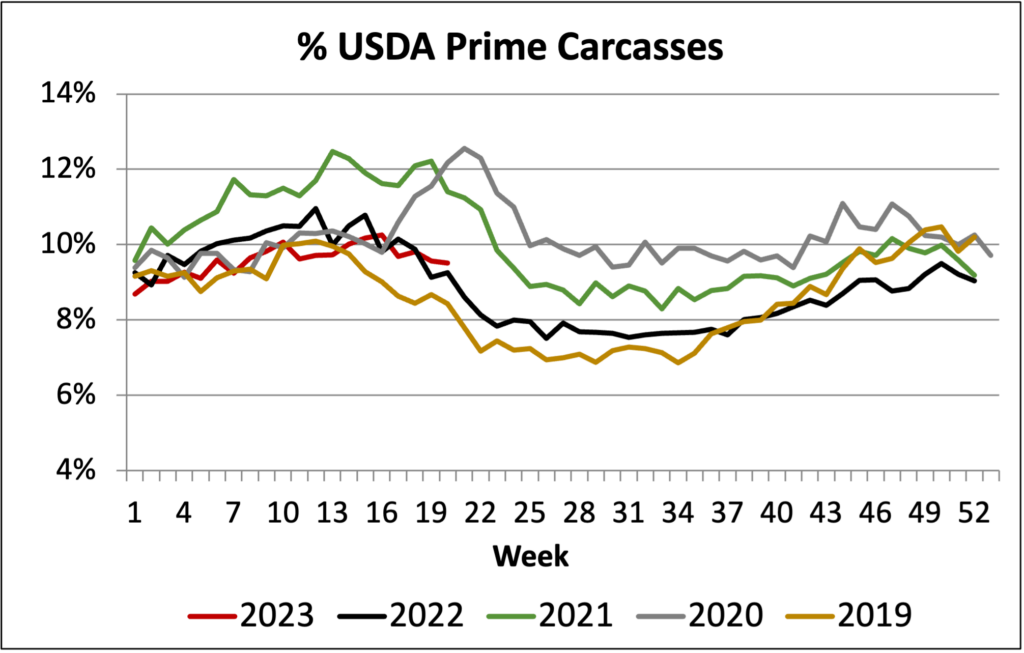
Singling out annual percent Prime grade trends results in a much more consistent pattern than when percent Choice is included. The ten-year trend for percent Prime suggests a strong vote that the annual low for the top USDA grade will come in June with six out of ten years claiming the June low. The month of July comes in as a second-place favorite with the seasonal bias favoring the two-month window.
Since 2018 the share of carcasses meeting all 10 carcass specifications for CAB has peaked in unison with the spring marbling highs in March. It then declines into early October when Modest and higher marbling (Premium Choice and Prime) carcasses are near their annual lows and carcass weights plus ribeye sizes are near their annual highs. The combination of these risk factors results in the annual lowest acceptance rates at that time.
As we turn the calendar to June it’s a fair assumption that percent USDA Prime and percent CAB Prime carcasses will fall off rapidly. The latest 9.5% Prime carcass grading rate is 0.25 percentage points ahead of a year ago. The year-over-year increase for the most current week is an improvement on the year as the Prime share has run 0.39 percentage points below 2022 so far.
More importantly, Prime carcass tonnage is 4.6% lower (over the last four weeks) than a year ago due to lower slaughter head counts. This smaller supply and projected sharp drop in the coming weeks meets up with seasonally heightened beef demand. The Prime carcass cutout value rests at 12.8% higher than a year ago and retail prices are hefty for Prime cuts. The supply side is set to build further premiums into USDA Prime and CAB Prime carcasses. That’s great to the extent that producers should see the rewards. Yet, the consumer side of the equation remains a question as to demand resiliency in a more challenging economic market.
Read More CAB Insider
Margins Sqeeze, Markets Cool: What It Means for Fed Cattle
Focused marketing of a premium beef brand demands some attention to tracking price spreads across differing quality specifications. The USDA quality grade scale provides the domestic measuring stick by which the trade differentiates demand across the quality spectrum.
Rapid Decline in Select Carcasses
The steep upward price trajectory in the fed cattle market remains wholly supported on fed cattle remaining in tight supply and the tight grasp of cattle feeders keeping feedlot stays and carcass weights elevated. Weights continue to underpin beef production tonnage, cutting the harvest pace deficit for fed cattle.
Beef Month Anticipation: Cattle and Beef Values
MARKET UPDATE...