Last time, I walked through the breakeven calculator for all those who want to dive deeper into the impact of carcass merit on feeder calf values. Now I want to plug in some real-world scenarios to show how this thing works. If you need to, catch up on Parts I & II of this series first, get the free calculator here, and then follow along.
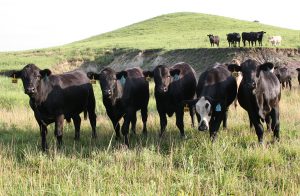
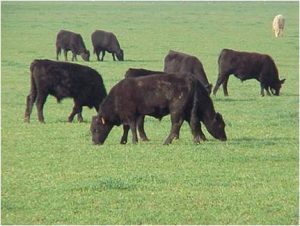
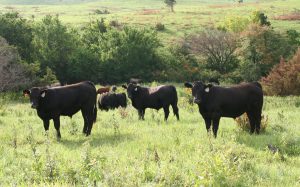
Take a look at these three different sets of yearling steers below. All three are black and have an average weight of 750 lb. Without any more information, you would expect to price all three sets at the same dollar value.
But what if I could predict the performance and carcass outcome of these three sets? If I knew the genetics and health program, and have data on past calf crops, I would be able to give the buyer much more insight into the value of these calves. Now how should they be priced?
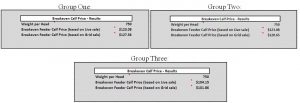
 Group 1: They will gain at 3.5 lb./day and convert at 6.1 units of feed to gain. They will have 1% death loss in the feedlot and when taken to the rail at 1325 lb. live weight, produce 5% Prime, 40% CAB®, 90% Choice, 30% YG1-2s,and 15% YG4s. And,these calves are age- and source-verified.
 Group 2: The same performance, death loss, and end weight as Group 1 but different carcass results. These cattle will go 0% Prime, 10% CAB®, 50% Choice, 5% Standard, 40% YG1-2s, and 5% YG4s. These calves are also age- and source-verified.
 Group 3: These cattle don’t have the genetics for performance or the health program that Groups 1 and 2 have. They will perform at 2.9 lb./day and convert at 7.0. They will have 4% death loss and an out weight of 1250 lb. They will have the same carcass results as Group 2.
Now, with this information in hand, how should I price these three sets of cattle? When you go to the calculator, you will be asked to fill in several cells. Remember, if you get stuck with what to plug into a particular cell, just place your cursor over the red arrow in the corner of the cell and some help information will pop up. Of course, you can always call or email me or Paul for help as well.
For this example I made some assumptions. One, the cattle would go on feed in March and be marketed in August. I used an August futures price of $116/lb. and a $2 basis. I then assumed that there would be 500 miles of freight on the cattle and my ration cost was going to be $275/ton (dry matter basis). I also put in some typical premiums and discounts for QG, YG and HCW. In particular, I plugged in a Ch-Se spread of $8/cwt., a Prime premium of $10/cwt., a CAB® premium of $3/cwt. and an age- and source-verification premium of $25/head.

When all three scenarios are plugged in, the calculator shows us that if these cattle will be sold on a grid when finished, there is nearly $200/head difference in the value of these three groups!
The calculator is also a great tool to look at the impact that different variables like ration cost, freight, and the Choice-Select spread have on the bottom line of your operation.
Again, if you’re a beef producer who is serious about calculating the value of your above-average cattle, having accurate input data is critical here. Keeping good records on past animal performance, getting the most current input-cost prices from your potential feeder and keeping an eye on current markets will help. As always, please feel free to utilize our staff as a resource. We may not always know the answer, but we will be able to help you find it!
Until next time,
-Mark